LUMI Performance Workshop - Copenhagen, Denmark (Nov. 2026)
Login to Lumi
ssh USERNAME@lumi.csc.fi
.ssh/config file.
# LUMI
Host lumi
User <USERNAME>
   Hostname lumi.csc.fi
   IdentityFile <HOME_DIRECTORY>/.ssh/id_rsa
   ServerAliveInterval 600
   ServerAliveCountMax 30
The ServerAlive* lines in the config file may be added to avoid timeouts when idle.
Now you can shorten your login command to the following.
ssh lumi
If you are able to log in with the ssh command, you should be able to use the secure copy command to transfer files. For example, you can
copy the presentation slides from lumi to view them. The training project is project_465003358.
scp lumi:/project/project_465003358/Slides/AMD/<file_name> <local_filename>
You can also copy all the slides with the . From your local system:
mkdir slides
scp -r lumi:/project/project_465003358/Slides/AMD/* slides
If you don't have the additions to the config file, you would need a longer command:
mkdir slides
scp -r -i <HOME_DIRECTORY>/.ssh/<public ssh key file> <username>@lumi.csc.fi:/project/project_465003358/slides/AMD/ slides
or for a single file
scp -i <HOME_DIRECTORY>/.ssh/<public ssh key file> <username>@lumi.csc.fi:/project/project_465003358/slides/AMD/<file_name> <local_filename>
HIP Exercises
We assume that you have already allocated resources with salloc
cp -r /project/project_465003358/Exercises/AMD/HPCTrainingExamples/ .
salloc -N 1 -p standard-g --gpus=1 -t 10:00 -A project_465003358 --reservation <reservation name>
module load craype-accel-amd-gfx90a
module load PrgEnv-amd
module load rocm
git clone https://github.com/amd/HPCTrainingExamples
/project/project_465003358/Exercises/AMD/HPCTrainingExamples.
Basic examples
cd HPCTrainingExamples/HIP/vectorAdd
Examine files here – README, Makefile and vectoradd_hip.cpp Notice that Makefile requires HIP_PATH to be set. Check with module show rocm or echo $HIP_PATH Also, the Makefile builds and runs the code. We’ll do the steps separately. Check also the HIPFLAGS in the Makefile.
export HCC_AMDGPU_TARGET=gfx90a
make
srun -n 1 ./vectoradd
We can use SLURM submission script, let's call it hip_batch.sh:
#!/bin/bash
#SBATCH -p standard-g
#SBATCH -N 1
#SBATCH --gpus=1
#SBATCH -t 10:00
#SBATCH --reservation <reservation name>
#SBATCH -A project_465003358

module load craype-accel-amd-gfx90a
module load rocm
cd $PWD/HPCTrainingExamples/HIP/vectorAdd

export HCC_AMDGPU_TARGET=gfx90a
make vectoradd
srun -n 1 --gpus 1 ./vectoradd
Submit the script
sbatch hip_batch.sh
Check for output in slurm-<job-id>.out or error in slurm-<job-id>.err
Compile and run with Cray compiler
CC -x hip vectoradd.hip -o vectoradd
srun -n 1 --gpus 1 ./vectoradd
Now let’s try the cuda-stream example from https://github.com/ROCm-Developer-Tools/HIP-Examples. This example is from the original McCalpin code as ported to CUDA by Nvidia. This version has been ported to use HIP. See add4 for another similar stream example.
git clone https://github.com/ROCm/HIP-Examples
export HCC_AMDGPU_TARGET=gfx90a
cd HIP-Examples/cuda-stream
make
srun -n 1 ./stream
export HCC_AMDGPU_TARGET=gfx90a is not needed in case one sets the target GPU for MI250x as part of the compiler flags as --offload-arch=gfx90a.
Now check the other examples in HPCTrainingExamples/HIP like jacobi etc.
Hipify
We’ll use the same HPCTrainingExamples that were downloaded for the first exercise.
Get a node allocation.
salloc -N 1 --ntasks=1 --gpus=1 -p standard-g -A project_465003358 -t 00:10:00 --reservation <reservation name>
A batch version of the example is also shown.
Hipify Examples
Exercise 1: Manual code conversion from CUDA to HIP (10 min)
Choose one or more of the CUDA samples in HPCTrainingExamples/HIPIFY/mini-nbody/cuda directory. Manually convert it to HIP. Tip: for example, the cudaMalloc will be called hipMalloc.
Some code suggestions include nbody-block.cu, nbody-orig.cu, nbody-soa.cu
You’ll want to compile on the node you’ve been allocated so that hipcc will choose the correct GPU architecture.
Exercise 2: Code conversion from CUDA to HIP using HIPify tools (10 min)
Use the hipify-perl script to “hipify” the CUDA samples you used to manually convert to HIP in Exercise 1. hipify-perl is in $ROCM_PATH/bin directory and should be in your path.
First test the conversion to see what will be converted
hipify-perl -no-output -print-stats nbody-orig.cu
You'll see the statistics of HIP APIs that will be generated.
[HIPIFY] info: file 'nbody-orig.cu' statistics:
  CONVERTED refs count: 7
  TOTAL lines of code: 82
  WARNINGS: 0
[HIPIFY] info: CONVERTED refs by names:
  cudaFree => hipFree: 1
  cudaMalloc => hipMalloc: 1
  cudaMemcpy => hipMemcpy: 2
  cudaMemcpyDeviceToHost => hipMemcpyDeviceToHost: 1
  cudaMemcpyHostToDevice => hipMemcpyHostToDevice: 1
hipify-perl is in $ROCM_PATH/bin directory and should be in your path.
Now let's actually do the conversion.
hipify-perl nbody-orig.cu > nbody-orig.cpp
Compile the HIP programs.
hipcc -DSHMOO -I ../ nbody-orig.cpp -o nbody-orig
The #define SHMOO fixes some timer printouts.
Add --offload-arch=<gpu_type> if not set by the environment to specify
the GPU type and avoid the autodetection issues when running on a single
GPU on a node.
- Fix any compiler issues, for example, if there was something that didn’t hipify correctly.
- Be on the lookout for hard-coded Nvidia specific things like warp sizes and inlined PTX code.
Run the program
srun ./nbody-orig
A batch version of Exercise 2 is:
#!/bin/bash
#SBATCH -N 1
#SBATCH --ntasks=1
#SBATCH --gpus=1
#SBATCH -p standard-g
#SBATCH -A project_465003358
#SBATCH -t 00:10:00
#SBATCH --reservation  <reservation name>

module load craype-accel-amd-gfx90a
module load rocm

export HCC_AMDGPU_TARGET=gfx90a

cd HPCTrainingExamples/HIPIFY/mini-nbody/cuda
hipify-perl -print-stats nbody-orig.cu > nbody-orig.cpp
hipcc -DSHMOO -I ../ nbody-orig.cpp -o nbody-orig
srun ./nbody-orig
cd ../../..
Notes:
- Hipify tools do not check correctness
hipconvertinplace-perlis a convenience script that doeshipify-perl -inplace -print-statscommand
Rocprof
Setup environment
salloc -N 1 --gpus=8 -p standard-g --exclusive -A project_465003358 -t 20:00 --reservation <reservation name>

module load PrgEnv-cray
module load craype-accel-amd-gfx90a
module load rocm
HIPIFY exercises
cd HPCTrainingExamples/HIPIFY/mini-nbody/hip/
Compile and run one case. We are on the front-end node, so we need to point he tools to use the correct GPU:
export HCC_AMDGPU_TARGET=gfx90a
make nbody-orig
Now Run rocprof on nbody-orig to obtain hotspots list
srun rocprof --stats nbody-orig 65536
cat results.csv
cat results.stats.csv
--basenames on will show only kernel names without their parameters.
srun rocprof --stats --basenames on nbody-orig 65536
cat results.stats.csv
--hip-trace
srun rocprof --stats --hip-trace nbody-orig 65536
results.hip_stats.csv
cat results.hip_stats.csv
--hsa-trace
srun rocprof --stats --hip-trace --hsa-trace nbody-orig 65536
results.hsa_stats.csv
cat results.hsa_stats.csv
results.json
scp -i <HOME_DIRECTORY>/.ssh/<public ssh key file> <username>@lumi.csc.fi:<path_to_file>/results.json results.json
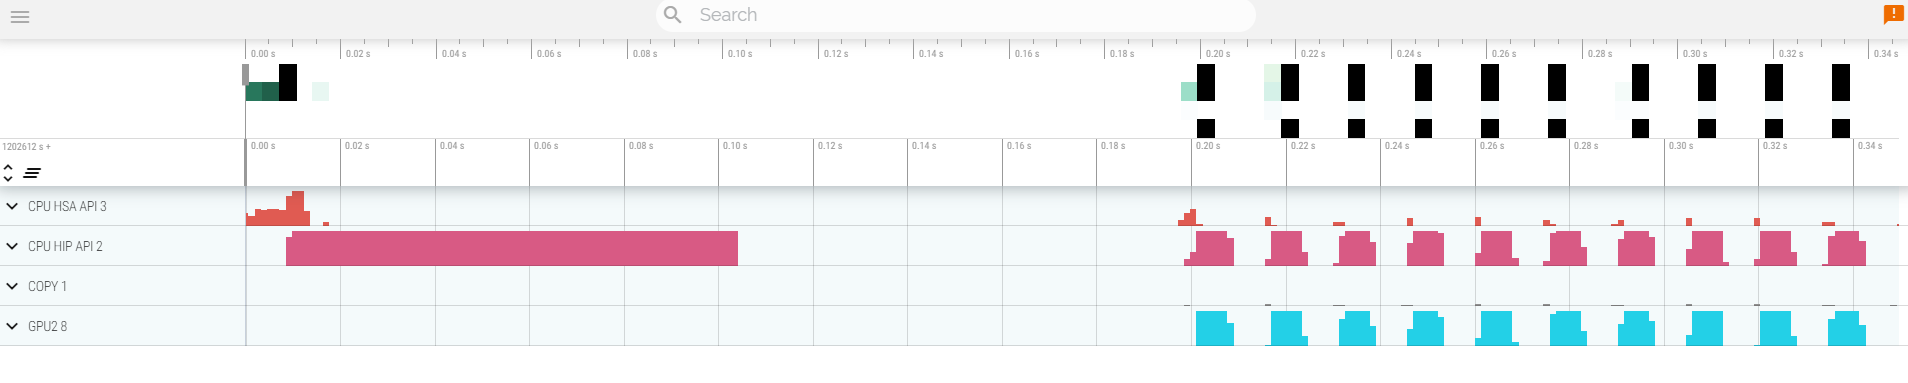
Open trace file in the top left corner.
Navigate to the results.json you just downloaded.
Use the keystrokes W,A,S,D to zoom in and move right and left in the GUI
Navigation
w/s Zoom in/out
a/d Pan left/right
Read about hardware counters available for the GPU on this system (look for gfx90a section)
less $ROCM_PATH/lib/rocprofiler/gfx_metrics.xml
rocprof_counters.txt file with the counters you would like to collect
vi rocprof_counters.txt
rocprof_counters.txt:
pmc : Wavefronts VALUInsts
pmc : SALUInsts SFetchInsts GDSInsts
pmc : MemUnitBusy ALUStalledByLDS
srun rocprof --timestamp on -i rocprof_counters.txt nbody-orig 65536
rocprof runs 3 passes, one for each set of counters we have in that file.
Contents of rocprof_counters.csv
cat rocprof_counters.csv
Exploring Rocprofiler-v3
ROCm 6.3.4 - LUMI default is in the transition Rocprof (v1) to Rocprofv3 so we recommend users adopt the new tool as it is becoming default in ROCm 6.4. If you wich trying more recnet version, e.g., ROCm 6.4.2 you can execute:
module use /appl/local/containers/test-modules
module load rocm/6.4.4
srun rocprofv3 --hip-trace --kernel-trace --memory-copy-trace --output-format=pftrace -- ./nbody-orig 65536
pftrace format that are more compatible with latest versions of the Perfetto UI https://ui.perfetto.dev/. The trace will look similar to what seen before with a slightly different convention for the namming of the different sections:

For convinience, the result files are located in a subfolder named after the node where it was run, e.g., nid<node ID>/<process ID>_results.pftrace. The tool should print the full path when it completes so you can just copy that to your workstation.
Rocprof-sys
- Load suitable ROCm version
Rocprof-sys is packaged with ROCm distribution. However, the default ROCm instalation on LUMI decided to not include that - so we use a different ROCm installation to provide the extra tools:
module load craype-accel-amd-gfx90a
module load PrgEnv-amd
module load cray-python

module use /appl/local/containers/test-modules
module load rocm/6.4.4
- Allocate resources with
salloc
salloc -N 1 --ntasks=1 --partition=standard-g --gpus=1 -A project_465003358 --time=00:15:00 --reservation <reservation name>
- Check the various options and their values and also a second command for description
srun -n 1 --gpus 1 rocprof-sys-avail --categories rocprofsys
srun -n 1 --gpus 1 rocprof-sys-avail --categories rocprofsys --brief --description
- Create an Rocprof-sys configuration file with description per option
srun -n 1 rocprof-sys-avail -G rocprofsys.cfg --all
- Declare to use this configuration file:
export ROCPROFSYS_CONFIG_FILE=$(realpath rocprofsys.cfg)
- Get the training examples:
cp -r /project/project_465003358/Exercises/AMD/HPCTrainingExamples/ .
-
Compile and execute saxpy
cd HPCTrainingExamples/HIP/saxpyhipcc --offload-arch=gfx90a -O3 -o saxpy saxpy.hiptime srun -n 1 ./saxpy
-
Check the duration
-
Compile and execute Jacobi
cd HPCTrainingExamples/HIP/jacobi
-
Now build the code (needs a couple of changes to accomodate the system MPI implementation)
sed -i 's/USE_CRAYPE=.*/USE_CRAYPE=yes/g' Makefilesed -i 's/IS_MPICH=.*/IS_MPICH=yes/g' Makefilemake -f Makefiletime srun -n 1 --gpus 1 Jacobi_hip -g 1 1
-
Check the duration
Dynamic instrumentation (the commands take a significant ammount of time)
-
Execute dynamic instrumentation on the
saxpyexample:cd HPCTrainingExamples/HIP/saxpytime srun -n 1 -c 7 --gpus 1 rocprof-sys-instrument -- ./saxpy- Check the duration - you'd seeing the instrumentation overhead.
-
Execute dynamic instrumentation on the Jacobi example:
cd HPCTrainingExamples/HIP/jacobitime srun -n 1 -c 7 --gpus 1 rocprof-sys-instrument -- ./Jacobi_hip -g 1 1- Check the duration - it will take a while. that is the point of this exercise: instrumenting is time consuming.
-
About Jacobi example, as the dynamic instrumentation would take long time, check what the binary calls and gets instrumented:
nm --demangle Jacobi_hip | egrep -i ' (t|u) ' - Available functions to instrument:
srun -n 1 -c 7 --gpus 1 rocprof-sys-instrument -v 1 --simulate --print-available functions -- ./Jacobi_hip -g 1 1- the simulate option means that it will not execute the binary
Binary rewriting (to be used with MPI codes and decreases overhead)
- Binary rewriting:
srun -n 1 --gpus 1 rocprof-sys-instrument -v -1 --print-instrumented functions -o jacobi.inst --function-include Jacobi -- ./Jacobi_hip- We created a new instrumented binary called jacobi.inst
- Activate text profile logic in your configuration file:
ROCPROFSYS_PROFILE = true - Executing the new instrumented binary:
time srun -n 1 --gpus 1 rocprof-sys-run -- ./jacobi.inst -g 1 1and check the duration - See the duration of the instrumented calls as well as GPU runtime activity:
cat rocprofsys-jacobi.inst-output/TIMESTAMP/wall_clock-0.txt
Visualization
- Copy the
perfetto-trace.prototo your laptop, open the web page https://ui.perfetto.dev/, click to open the trace and select the file.
Hardware counters
- See a list of all the counters:
srun -n 1 --gpus 1 rocprof-sys-avail --all - Declare in your configuration file the counters you want to collect, e.g.:
ROCPROFSYS_ROCM_EVENTS = GRBM_COUNT,SQ_WAVES - Execute:
srun -n 1 --gpus 1 rocprof-sys-run -- ./jacobi.inst -g 1 1and copy the perfetto file and visualize
Sampling
Activate in your configuration file ROCPROFSYS_USE_SAMPLING = true and ROCPROFSYS_SAMPLING_FREQ = 100, execute and visualize. You should be able to see call-stack information as part of your trace.
You can execute the plain binary as sampling does not require prior instrumentation:
srun -n 1 --gpus 1 rocprof-sys-run -- ./Jacobi_hip -g 1 1
Kernel timings
- Open the file
rocprofsys-<binary>-output/timestamp/wall_clock-0.txt(replace binary and timestamp with your information) - In order to see the kernels gathered in your configuration file, make sure that
ROCPROFSYS_PROFILE = trueandROCPROFSYS_FLAT_PROFILE = true, execute the code and open again the filerocprofsys-<binary>-output/timestamp/wall_clock-0.txt
Rocprof-compute
- Load and prepare Rocprof-compute:
Rocprof-compute uses a separate instalation as it is not part of ROCm default instalation. Let's load it in our environment.
module load craype-accel-amd-gfx90a
module load PrgEnv-amd
module load cray-python

module use /appl/local/containers/test-modules
module load rocm/6.4.4
There are some Python dependencies needed. The tool is not assuming a particular Python version as that should be compatible with workload (it it uses Python). for simplicity we use an existing Python version provided by the cray-python module. The extra packages can be loaded into your environment with:
python3 -m venv venv
source venv/bin/activate
pip install -r $ROCM_PATH/libexec/rocprofiler-compute/requirements.txt
pip install "plotly<6.1"
The last line keeps plotly compatible with the kaleido version required by the tool - it is needed for the roofline PDF generation.
- Reserve a GPU, compile the exercise and execute rocprof-compute, observe how many times the code is executed. Note that we use
rocprofv2to collect the data. We could userocprofv3but that requires all GPUs in the node visible - this is a limitation that will be lifted in more recent version.
salloc -N 1 --ntasks=1 --partition=small-g --gpus=1 -A project_465003358 --time=00:30:00
cp -r /project/project_465003358/Exercises/AMD/HPCTrainingExamples/ .
source venv/bin/activate
cd HPCTrainingExamples/HIP/dgemm/
mkdir build
cd build
cmake ..
make
cd bin
ROCPROF=rocprofv2 srun -n 1 --gpus 1 rocprof-compute profile -n dgemm -- ./dgemm -m 8192 -n 8192 -k 8192 -i 1 -r 10 -d 0 -o dgemm.csv
-
Run
srun -n 1 --gpus 1 rocprof-compute profile -hto see all the options -
Now is created a workload in the directory workloads with the name dgemm (the argument of the -n). So, we can analyze it
srun -n 1 --gpus 1 rocprof-compute analyze -p workloads/dgemm/MI210/ &> dgemm_analyze.txt
- If you want to do only roofline analysis, then execute - this would also generate PDF files to facilitate visualization:
srun -n 1 rocprof-compute profile -n dgemm --roof-only --roofline-data-type FP64 -- ./dgemm -m 8192 -n 8192 -k 8192 -i 1 -r 10 -d 0 -o dgemm.csv
There is no need for srun to analyze but we want to avoid everybody to use the login node. Explore the file dgemm_analyze.txt
- We can select specific IP Blocks, like:
srun -n 1 --gpus 1 rocprof-compute analyze -p workloads/dgemm/MI210/ -b 7.1.2
But you need to know the code of the IP Block
- If you have installed rocprof-compute on your laptop (no ROCm required for analysis) then you can download the data and execute:
rocprof-compute -p workloads/dgemm/MI210/ --gui
- Open the web page: http://IP:8050/ The IP will be displayed in the output
For more exercises, visit here: https://github.com/amd/HPCTrainingExamples/tree/main/rocprof-compute or locally HPCTrainingExamples/rocprof-compute, there are 5 exercises, in each directory there is a readme file with instructions.
Thread tracing
Counters tell us how much time a kernel spends on, e.g., memory or ALU instructions. The Advanced Thread Trace (ATT) shows where: it records the instruction-level execution of the waves on a compute unit, so you can see which instructions (and, when the code is built with -g, which source lines) accumulate the latency and stalls. In this short exercise we use rocprofv3 --att on a small GEMM example. The example has more than one kernel, we use two of them with intentionally different performance:
| Kernel | What it does |
|---|---|
matmul_naive |
One output per thread; the inner loop reads A and B from global memory in every iteration. |
matmul_fast |
16x16 tiles staged through LDS (__shared__) with __syncthreads and padded tiles to avoid bank conflicts. |
For this exercise we use a more recent ROCm toolchain than the LUMI default:
module load craype-accel-amd-gfx90a
module use /appl/local/containers/test-modules/
module load rocm-afar/24.3.0
Allocate a GPU, get the examples and build (the example is compiled with -g -gdwarf-4, which is what allows ATT to map instructions back to source lines):
salloc -N 1 --ntasks=1 --partition=standard-g --gpus=1 -A project_465003358 --time=00:30:00 --reservation <reservation name>
cp -r /project/project_465003358/Exercises/AMD/HPCTrainingExamples/ .
cd HPCTrainingExamples/Rocprofv3/ThreadTrace
make clean && make
Run the application first, without the profiler, to check it works and see the correctness check pass:
srun -n 1 --gpus 1 ./matmul
Now collect a thread trace. --att enables the thread trace, --att-activity 8 streams the SQ activity into the ATT buffer and -d <directory> selects the directory where the results are written (the argument is mandatory). A thread trace is large, so we limit what is traced in two ways: --kernel-include-regex restricts the collection to one kernel at a time (the application still runs all of them), and --kernel-iteration-range 6 traces only the 6th execution of that kernel. The application runs each kernel 2 times as warm-up and then 5 timed times, so the 6th execution is a timed one, after warm-up. Each of these takes about a minute:
rocprofv3 --att --att-activity 8 -d att_naive --kernel-iteration-range 6 --kernel-include-regex matmul_naive -- srun -n 1 --gpus 1 ./matmul
rocprofv3 --att --att-activity 8 -d att_fast --kernel-iteration-range 6 --kernel-include-regex matmul_fast -- srun -n 1 --gpus 1 ./matmul
You can ignore the warnings about SPM and the agent topology. Without these two options, every dispatch of every kernel is traced, which takes much longer and produces more than 1 GB of data (see make trace in the example, and rocprofv3 --help).
The results of each run are written to its directory (e.g. att_naive):
stats_ui_output_agent_*_dispatch_*.csv- per-instruction summary: latency, stall and idle cycles, plus aSourcecolumn with the line of source code each instruction comes from. Open it withcat/lessor, after copying it, with a spreadsheet and sort by the stall or latency columns.ui_output_agent_*_dispatch_*- the directory with the data of the traced dispatch for ROCprof Compute Viewer (RCV).<hostname>/- the raw.attthread trace and the code objects (.out) used by the tools. You do not need to copy this one.
Visualizing with ROCprof Compute Viewer (RCV)
RCV is a GUI application that is not available on LUMI: you need to install it on your own workstation. Go to the RCV releases page, expand the Assets of the latest release and pick the binary that matches your system - there are packages for Windows and macOS.
Copy the output of the trace to your workstation, e.g., from your local system:
scp -r lumi:<path_to_run_folder>/att_naive/ui_output_agent_* .
scp -r lumi:<path_to_run_folder>/att_fast/ui_output_agent_* .
Each ui_output_agent_*_dispatch_* directory is up to ~600 MB (matmul_naive; matmul_fast is about 200 MB). Open RCV and use its open option to select one of these directories (the one you want to look at, not its parent). The source code lines are shown only if the source file exists at the path recorded in the trace (the Source column of the csv); the instruction view works regardless. Things to try:
- In the instruction view, sort by latency or stall to find the hottest instructions and the source lines they map to. Compare the hotspots of
matmul_naiveandmatmul_fast: what are the instructions that wait the most in each case, and why? - In the Compute Unit and Utilization views, look at how the waves of the kernel are scheduled on the SIMDs and how busy each pipeline (VALU, VMEM, LDS, SALU...) is over time.
- Compare the two kernels: where did the tiling in
matmul_fastmove the time to?
Pytorch example
This example is supported by the files in /project/project_465003358/Exercises/AMD/Pytorch.
These script experiment with different tools with a more realistic application. They cover PyTorch, how to install it, run it and then profile and debug a MNIST based training. We selected the one in https://github.com/kubeflow/examples/blob/master/pytorch_mnist/training/ddp/mnist/mnist_DDP.py but the concept would be similar for any PyTorch-based distributed training.
This is mostly based on a two node allocation. Copy the scripts to your own folder and allocate the nodes before running them (the scripts use the first job reported by squeue --me):
cp -r /project/project_465003358/Exercises/AMD/Pytorch .
cd Pytorch
N=2 ; salloc -p standard-g --threads-per-core 1 --exclusive -N $N --gpus $((N*8)) -t 4:00:00 --mem 0 -A project_465003358 --reservation <reservation name>
The profiling tools used by 08 to 12 are provided to the container through a squashfs image (deps.sqsh) that is already available in /project/project_465003358/Exercises/AMD/Pytorch, so you don't need to run 07 to follow the exercises. The scripts use that image by default - to use another one, set DEPS, e.g., DEPS=$PWD/deps.sqsh ./08-mnist-rocprof.sh.
-
Installing PyTorch directly on the filesystem using the system python installation.
./01-install-direct.sh -
Installing PyTorch in a virtual environment based on the system python installation.
./02-install-venv.sh -
Installing PyTorch in a conda environment based on the python version in the conda package.
./03-install-conda.sh -
Testing a container prepared for LUMI that comprises PyTorch.
./04-test-container.sh -
Test the right affinity settings.
./05-afinity-testing.sh -
Complete example with MNIST training with all the trimmings to run it properly on LUMI.
./06-mnist.sh -
Using squashfs as a way to make profilling tools available in containers.
./07-create-squashfs.sh -
Example with rocprofv3:
./08-mnist-rocprof.sh -
Communication tests with RCCL - effects of disabling AWS CXI plugin:
./09-rccltest.shNCCL_NET_PLUGIN=noexist ./09-rccltest.sh -
Examples using rocprof-sys and rocprof-compute.
./10-mnist-rocprof-sys.sh./11-mnist-rocprof-sys-python.sh./12-mnist-rocprof-compute.sh -
Example using Pytorch built-in profiling capabilities.
./13-mnist-pytorch-profile.sh
HIP optimization
Optimizing DAXPY HIP
In this exercise, we will progressively make changes to optimize the DAXPY kernel on GPU. Any AMD GPU can be used to test this.
DAXPY Problem:
Z = aX + Y
a is a scalar, X, Y and Z are arrays of double precision values.
In DAXPY, we load 2 FP64 values (8 bytes each) and store 1 FP64 value (8 bytes). We can ignore the scalar load because it is constant. We have 1 multiplication and 1 addition operation for the 12 bytes moved per element of the array. This yields a low arithmetic intensity of 2/24. So, this kernel is not compute bound, so we will only measure the achieved memory bandwith instead of FLOPS.
Inputs
N, the number of elements inX,YandZ.Nmay be reset to suit some optimizations. Choose a sufficiently large array size to see some differences in performance.
Build Code
module load craype-accel-amd-gfx90a
module use /appl/local/containers/test-modules
module load rocm/6.2.4

git clone https://github.com/amd/HPCTrainingExamples.git
cd HPCTrainingExamples/HIP-Optimizations/daxpy
make
Run exercises
salloc -N 1 --ntasks=1 --partition=small-g --gpus=1 -A project_465003358 --time=00:30:00
srun ./daxpy_1 10000000
srun ./daxpy_2 10000000
srun ./daxpy_3 10000000
srun ./daxpy_4 10000000
srun ./daxpy_5 10000000
Things to ponder about
daxpy_1
This shows a naive implementation of the daxpy problem on the GPU where only 1 wavefront is launched and the 64 work-items in that wavefront loop over the entire array and process 64 elements at a time. We expect this kernel to perform very poorly because it simply utilizes a part of 1 CU, and leaves the rest of the GPU unutilized.
daxpy_2
This time, we are launching multiple wavefronts, each work-item now processing only 1 element of each array. This launches N/64 wavefronts, enough to be scheduled on all CUs. We see a big improvement in performance here.
daxpy_3
In this experiment, we check to see if launching larger workgroups can help lower our kernel launch overhead because we launch fewer workgroups if each workgroup has 256 work-items. In this case too, an improvement in measured bandwidth achieved is seen.
daxpy_4
If we ensured that the array has a multiple of BLOCK_SIZE elements so that all work-items in each workgroup have an element to process, then we can avoid the conditional statement in the kernel. This could reduce some instructions in the kernel.. Do we see any improvement? In this trivial case, this does not matter. Nevertheless, it is something we could keep in mind.
Question: What happens if BLOCK_SIZE is 1024? Why?
daxpy_5
In this experiment, we will use double2 type in the kernel to see if the compiler can generate global_load_dwordx4 instructions instead of global_load_dwordx2 instructions. So, with same number of load and store instructions, we are able to read/write two elements from each array in each thread. This should help amortize on the cost of index calculations.
To show this difference, we need to generate the assembly for these two kernels. To generate the assembly code for these kernels, ensure that the -g --save-temps flags are passed to hipcc. Then you can find the assembly code in daxpy_*-host-x86_64-unknown-linux-gnu.s files. Examining daxpy_3 and daxpy_5, we see the two cases (edited here for clarity):
daxpy_3:
    global_load_dwordx2 v[2:3], v[2:3], off
    v_mov_b32_e32 v6, s5
    global_load_dwordx2 v[4:5], v[4:5], off
    v_add_co_u32_e32 v0, vcc, s4, v0
    v_addc_co_u32_e32 v1, vcc, v6, v1, vcc
    s_waitcnt vmcnt(0)
    v_fmac_f64_e32 v[4:5], s[6:7], v[2:3]
    global_store_dwordx2 v[0:1], v[4:5], off
daxpy_5:
    global_load_dwordx4 v[0:3], v[0:1], off
    v_mov_b32_e32 v10, s5
    global_load_dwordx4 v[4:7], v[4:5], off
    s_waitcnt vmcnt(0)
    v_fmac_f64_e32 v[4:5], s[6:7], v[0:1]
    v_add_co_u32_e32 v0, vcc, s4, v8
    v_fmac_f64_e32 v[6:7], s[6:7], v[2:3]
    v_addc_co_u32_e32 v1, vcc, v10, v9, vcc
    global_store_dwordx4 v[0:1], v[4:7], off
daxpy_5 case, there are two v_fmac_f64_e32 instructions as expected, one for each element being processed.
Notes
- Before timing kernels, it is best to launch the kernel at least once as warmup so that those initial GPU launch latencies do not affect your timing measurements.
- The timing loop is typically several hundred iterations.
- You may find that the various optimizations work differently in MI200 vs MI300 devices, and this may be due to differences in hardware architecture.